Downtown Today
The data behind the headlines
This report was made possible with generous support from:

A LETTER FROM THE PRESIDENT & CEO
Surrounded by stunning natural beauty and fueled by a history of innovation, downtown Seattle is the region’s center of commerce and culture. It’s everybody’s neighborhood — a place where people come together to share experiences they can’t get anywhere else. Our center city is on a strong path to progress, with key economic metrics moving in a positive direction.
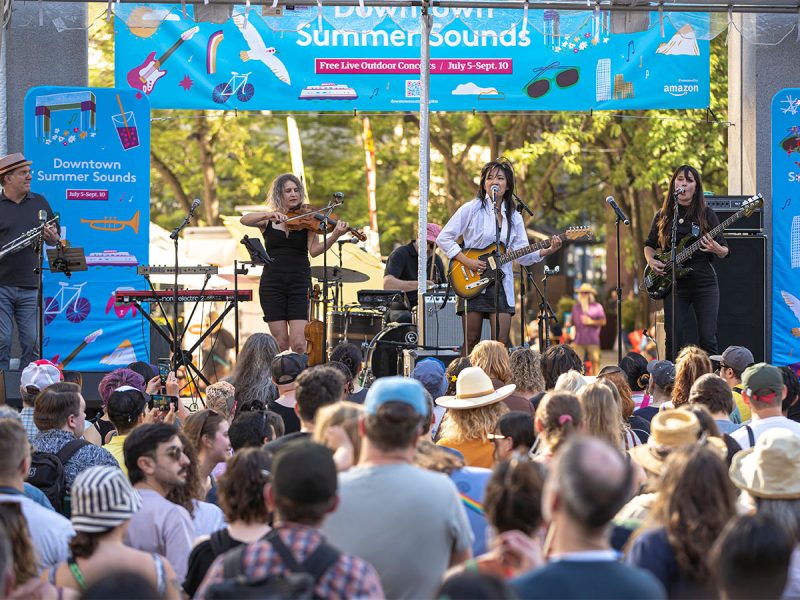
We’re seeing more returning workers and local visitors. Drawn downtown in part by the redevelopment of our central waterfront, including the stunning new Overlook Walk, locals are visiting in numbers we have not seen in years.
Seattle leads 10 peer downtowns for the total number of development projects completed in 2024, including commercial and residential. The number of people living downtown now tops 108,000. And further adding to our vibrancy, 88 new street-level businesses opened in 2024.
With strong support from the city, we have seen marked improvements in street disorder that has chronically plagued parts of the center city. Violent crime in the core of downtown has declined in the last year, along with fentanyl-related overdoses.
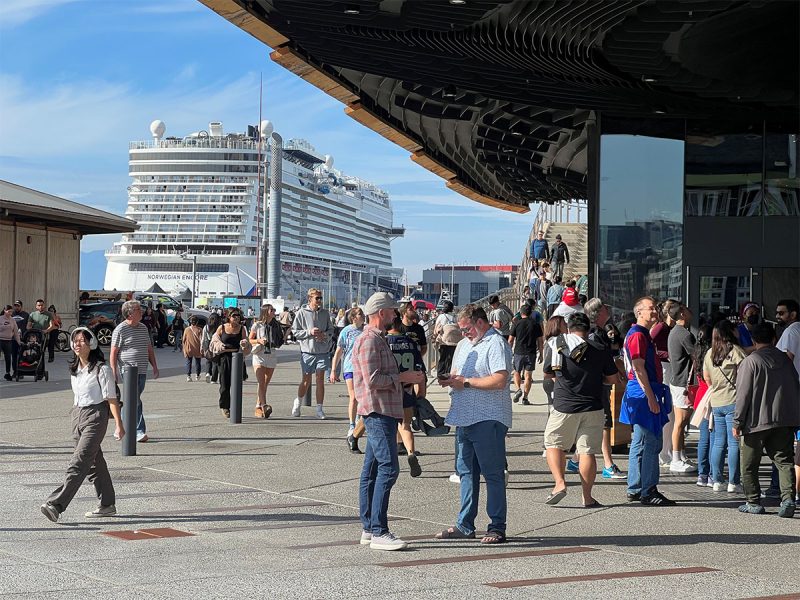
Looking ahead, we have much to celebrate, including the restoration and revitalization of public spaces along Elliott Bay. Seattle’s new Waterfront Park is on the cusp of fully opening and the Elliott Bay Connections project, funded entirely by private philanthropists, will be complete by summer 2026 before Seattle welcomes the FIFA Men’s World Cup. With public-private support, a new Memorial Stadium will open in 2027 at Seattle Center. Adding to our strong cultural offerings, Cannonball Arts — a contemporary arts center — will open in 2025 in the heart of downtown. And eight more regional light rail stations will open in the next two years, with new train service strengthening connections to areas north, east and south of downtown.
As we continue on our strong path to revitalization, DSA remains committed to fostering a downtown for all. We believe the downtowns that celebrate diversity and welcome all are more dynamic, desirable and resilient.
Whether you’re a longtime DSA member, potential investor or exploring the benefits of DSA membership, we are grateful for your support and interest in helping us champion one of the most beautiful and vibrant downtowns in the country.

Sincerely,
Jon Scholes
President & CEO
Downtown Seattle Association
A LETTER FROM THE MAYOR
In 2024, we made important progress toward fostering the safe, vibrant and welcoming destination that we all want to see.
With a focus on public safety, we launched the Downtown Activation Team with partners like DSA, providing robust and coordinated cleaning, safety operations and targeted activations downtown and in the CID. Along Third Avenue in the Pike Pine Core, we’ve seen a projected 27% decrease in violent crime, a 14% decrease in emergency service calls, and a 30% decrease in emergency medical responses compared to 2023. I look forward to expanding this model to more locations downtown and across the city.
2024 was a banner year for enhancing our built environment as the vision for our reimagined waterfront came into focus with the opening of the incredible Overlook Walk and the Seattle Aquarium’s Ocean Pavilion. We added new lighting at Hing Hay Park and along Third Avenue and unveiled over 30 new murals, including the largest in North America.
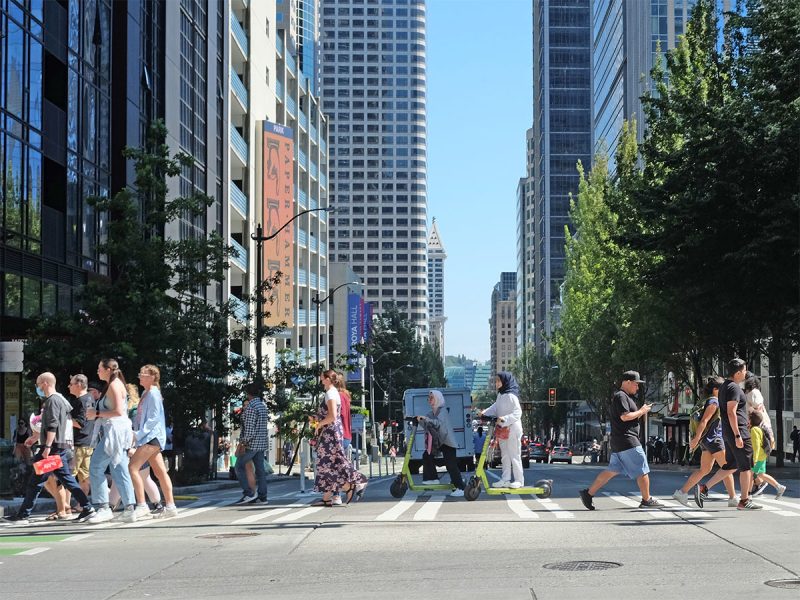
The proof that all this is working? People. Downtown welcomed more than 11 million visitors this summer, 10.5 million visitors to Seattle Center, and averaged more than 89,000 daily workers.
Our Downtown Activation Plan drives our approach, focused on incentivizing new housing, small businesses, and a diverse array of jobs. There is so much more to come for downtown — from the completion of the waterfront to welcoming the globe to Seattle for FIFA World Cup 2026 in less than 500 days.
Downtown is the heartbeat of our city and, together, we are going beyond a Monday-to-Friday pitstop to create a dynamic Sunday-to-Sunday neighborhood – a place where people can truly live, work and explore every day of the week. Let’s keep at it.

In service,
Mayor Bruce Harrell
Working together to build One Seattle.
Downtown Seattle is a collection of 12 neighborhoods that account for approximately half of all the economic activity in Seattle. Downtown is home to some of the densest neighborhoods in the Pacific Northwest. In fact, more than one in 10 Seattleites calls downtown home.
WITH SUPPORT FROM

DSA draws on several sources to provide the most up-to-date picture of the downtown economy using the best information available at the time. Occasionally, information from multiple sources is combined to create current-year estimates. Estimation methods can be highly uncertain during a major disruption such as COVID-19, and many previously used methodologies could not account for the effects of the pandemic on our economy. Therefore, several previous methodologies were changed in 2020 and 2021 to derive recent estimates.