Downtown Dashboard
October 2026 (September data)
DSA publishes a monthly dashboard examining dozens of key metrics that affect our urban core’s vitality and local economy. The data sets provide a comparison point to the same period in 2019. Additionally, the dashboard will feature notable stories that provide context regarding downtown’s health and progress.
Please credit the Downtown Seattle Association’s Downtown Dashboard for use of charts, data and images on this page.
Unique monthly visitors compared to 2019
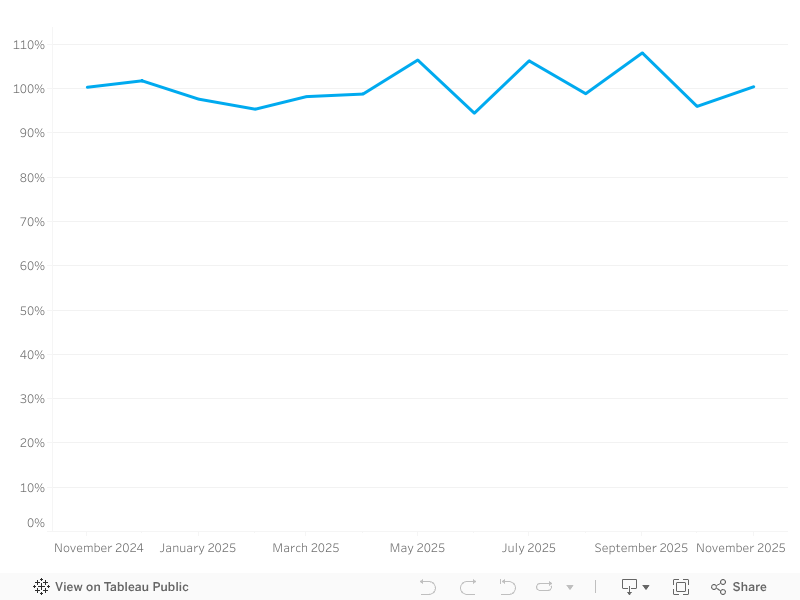
More than 3 million unique visitors came downtown in September 2026. This represents 103% of the visitors seen in September 2019 and a slight 3-point decrease from September 2025.
Note: Foot traffic only includes domestic visitors.
Average weekday worker foot traffic
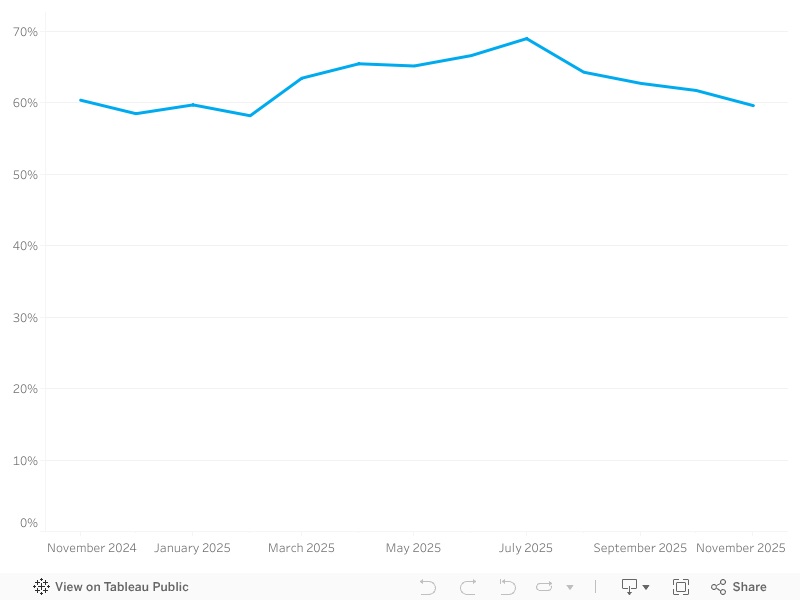
In September, downtown’s worker foot traffic was 62% of September 2019’s daily average. September 2026 averaged more than 145,000 daily workers, similar to September 2025.
Monthly hotel rooms sold compared to 2019
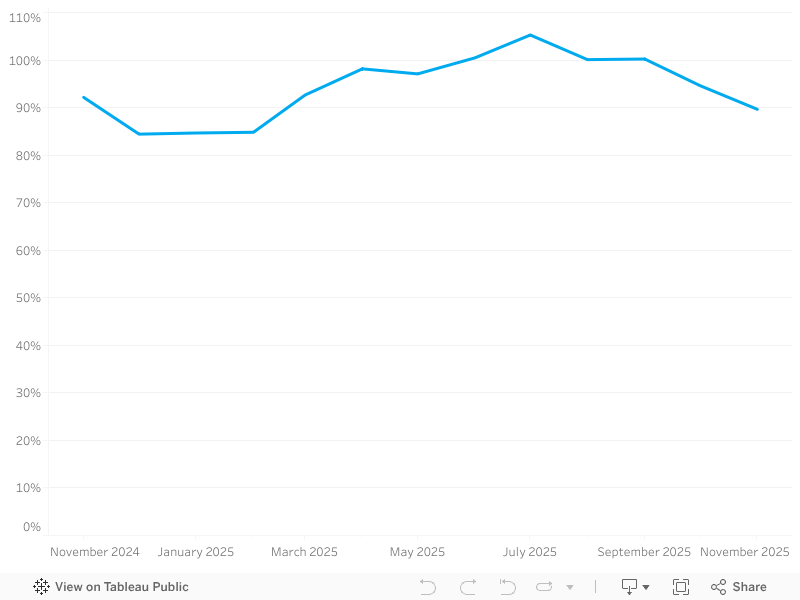
Nearly 412,000 downtown hotel rooms sold in September 2026. Representing 108% of September 2019 demand, and a 4% increase compared to September 2025, marking the third straight month where downtown demand surpassed 400,000.
Quarterly
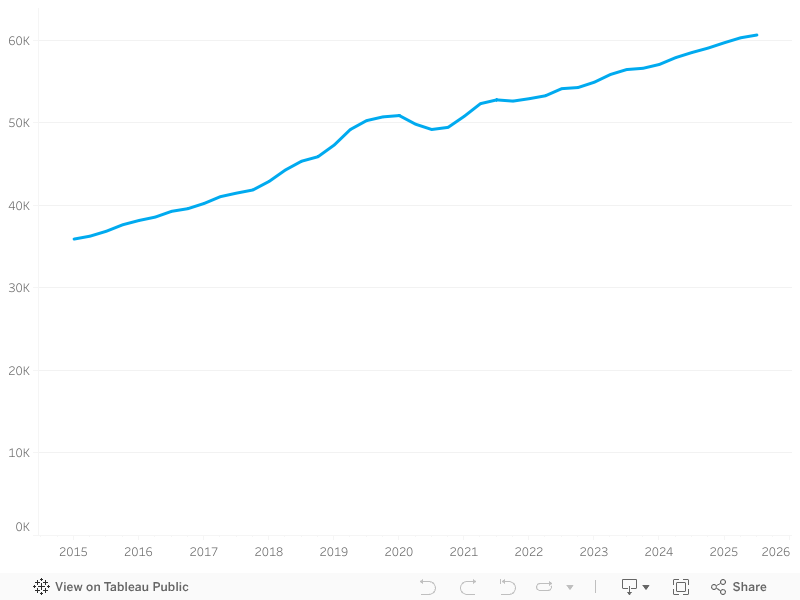
In September, the number of occupied apartment units downtown remained around 62,000 units. This represents a 1% increase compared to Q3 2025 and a 21% increase compared to Q2 2019.
Of Note in Downtown

Consumer activity was strong downtown toward the end of the summer. According to Datafy, $178.9 million was spent in August (the most recent reporting month). That marks a 10.8% increase compared to July’s downtown spending data.

Between June and September, downtown Seattle visits increased 9% compared to the same period in 2025. Summer 2026 saw downtown foot traffic reach nearly 34.5 million visits, one of the highest four-month periods since 2019.

The DSA/MID Clean Team removed 31,768 graffiti tags and stickers from public infrastructure and private property the first nine months of 2026. The team removed 5,577 last month alone.

DSA member Lime is reporting Seattle riders have already taken more than 10.5 million rides, surpassing the total number of 2025 rides. Four of Lime’s top five ridership days ever in Seattle took place during FIFA World Cup.
Coming Up in Downtown

Seattle Restaurant Week
For two weeks, some of our favorite restaurants are offering fantastic deals. Explore downtown’s culinary scene Oct. 18–31 with special menus at $25, $35, $50 and $65. Visit srweek.org for participating restaurants.

Dia de Muertos at Festál
Seattle Center’s Festál series continues with Dia de Muertos at the Armory Oct. 31–Nov. 1. The festival features live performances, elaborate alters, sugar skill workshops, visual art and more.

Dance Theatre of Harlem
The internationally acclaimed Dance Theatre of Harlem takes the stage at The Paramount Theatre Oct. 30–31. Formed in 1969 at the height of the Civil Rights Movement, the Dance Theatre of Harlem has been called one of the most influential ballet companies of the last 50 years.
Notes on Sources
Datafy measures consumer spending by analyzing a cross‑section of credit and debit card transactions and cell phone location data.
Downtown foot traffic data are provided by Placer.ai and are based on cell phone location data. Each person is counted once per day. International visitors are not included. Subsets of this data in the charts are as follows:
- Office worker presence is estimated based on visits by workers who were present between 8 a.m. and 6 p.m. on weekdays in downtown Seattle.*
- Hotel data are based on monthly reports from STR, provided by Visit Seattle.
- Apartment occupancy data are from CoStar. This is reported quarterly but the current quarter data are updated in real-time as new information is added to the database.
- Domestic visitors counts those who do not live or work downtown.
- Total foot traffic includes all visits to downtown by domestic visitors, residents and workers.
- Pike Place Market visitors includes domestic visitors who do not live or work at the Pike Place Market.
*Note that workers who have not visited their work site in the past 90 days are classified as “visitors” until they are regularly visiting their work site at least three times in a one-week period.