Downtown Today
The data behind the headlines
This report was made possible with generous support from:

A LETTER FROM THE PRESIDENT & CEO
Downtown Seattle continues its evolution into a denser, more vibrant neighborhood — with a mix of experiences you can’t get anywhere else.
Today, nearly 110,000 people call downtown home, making up about one in seven Seattleites. Over the past decade, the residential population has grown 53%. In 2025 alone, more than 1,600 new multifamily homes were delivered in the city center, with thousands more under construction. Nearly half of all housing built in Seattle since 2019 has been concentrated here, reinforcing downtown’s evolution into a true mixed-use community.
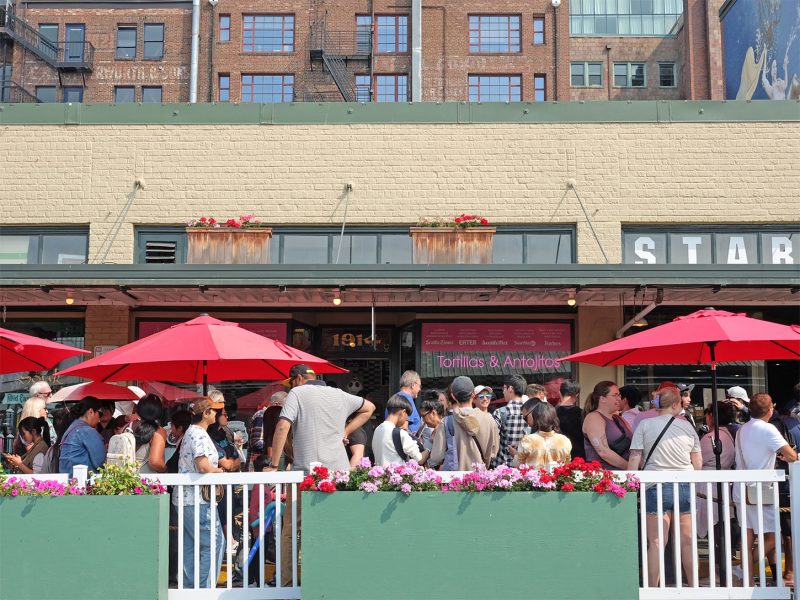
Downtown is also seeing steady gains in visitation and activity. Total unique visitors in 2025 once again exceeded pre-pandemic levels, topping 15 million, while overall visits increased by 3 million, a strong indication that people are returning more frequently. Daily foot traffic rose nearly 4% year-over-year, and light rail boardings at our four downtown stations climbed 23%, surpassing 9.2 million rides. Local visitors, essential to the vitality of our small businesses, restaurants and arts and culture organizations, increased both in number and frequency, particularly along the Pike/Pine corridor and the improved waterfront.
Public safety trends show important improvement in the downtown core, where violent crime declined to its lowest level since at least 2017, excluding the pandemic year. At the same time, persistent challenges remain in parts of Belltown and Chinatown–International District, underscoring the need for additional police and safety resources.
There are also headwinds. Downtown experienced an estimated loss of 13,000 jobs in 2025 — the largest annual decline since the first year of the pandemic — and hotel demand softened year-over-year for the first time since 2019.
Looking ahead, 2026 represents a defining opportunity. From hosting FIFA World Cup matches and expanding light rail connections to completing transformative investments at Myrtle Edwards and Centennial parks, advancing major civic projects and working with new city and county administrations, downtown is poised to elevate its national and international profile.
DSA remains committed to fostering a healthy, vibrant downtown for all. Whether you’re a longtime member, potential investor or exploring the benefits of membership, we are grateful for your support in helping us champion one of the premier, most innovative urban cores in the country.

Sincerely,
Jon Scholes
President & CEO
Downtown Seattle Association
A LETTER FROM THE MAYOR
Downtown is a local, regional, national, and international destination that’s one of our city’s economic engines. And this year it’s going to be on display before the world like never before.
The Seahawks World Championship Parade brought hundreds of thousands of people from across the region to the heart of our downtown to share in a joyous, spirited celebration of civic pride. Later this summer, the FIFA World Cup will bring people from around the world to our downtown for matches, watch parties, and other festivities. And these visitors will experience something truly special: our new waterfront. The transformation of our waterfront has reconnected our city to Elliott Bay in ways we haven’t seen in generations. It’s a place for families, workers, and visitors to gather — a public space that reflects who we are and what we value.
Downtown Seattle is also a home to nearly 110,000 people, a cluster of neighborhoods with their own identities that are as much a part of the city’s tapestry as anywhere else. Downtown has incredible public spaces, amazing local businesses, a new playground, a great public bathroom, and so many other amazing things to do. In many ways, it’s a model of what a vibrant neighborhood can look like.
I know that people and businesses downtown struggle with the same core challenges as the rest of the city: affordability, public safety, and homelessness. These are also my top priorities as mayor, and I’m determined to strengthen our partnerships with the Downtown Seattle Association, neighborhood leaders, service providers, small businesses, and major employers to improve public safety, address homelessness with compassion and urgency, and ensure downtown is clean, welcoming, and thriving.
I recently launched my affordability agenda, focused on affordable housing, affordable food, affordable childcare, and making Seattle an affordable place to build a business. I am also launching a comprehensive approach to gun violence prevention, and I am focused on finally making progress on our homelessness crisis by opening 1,000 new shelter beds this year. All of these priorities will help downtown grow even stronger.
When people around the world think of Seattle, they picture the skyline tucked between the water and the mountains. They picture our stadiums, our ferries, and of course the Space Needle. They picture downtown.
It’s an extraordinary asset, an amazing place to visit, and an incredible place to live. And this year it’s going to be better than ever.

Mayor Katie B. Wilson
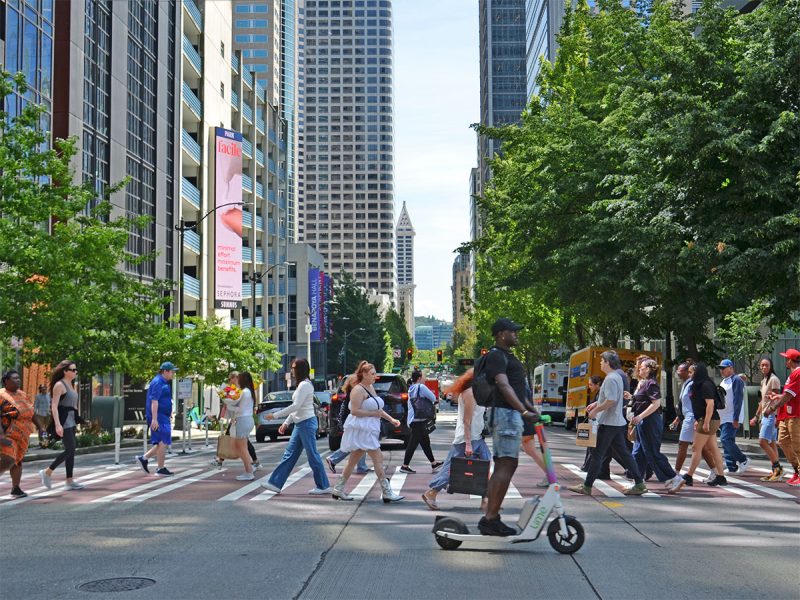
Downtown Seattle is a collection of 12 neighborhoods that account for approximately half of all the economic activity in Seattle. Downtown is home to some of the densest neighborhoods in the Pacific Northwest. In fact, more than one in 10 Seattleites calls downtown home.
WITH SUPPORT FROM


DSA draws on several sources to provide the most up-to-date picture of the downtown economy using the best information available at the time. Occasionally, information from multiple sources is combined to create current-year estimates. Estimation methods can be highly uncertain during a major disruption such as COVID-19, and many previously used methodologies could not account for the effects of the pandemic on our economy. Therefore, several previous methodologies were changed in 2020 and 2021 to derive recent estimates.