Economic Revitalization
Tracking downtown revitalization
Since the onset of COVID-19, DSA has been tracking the impact on our local economy. As downtown bounces back, we continue to follow dozens of metrics to trace the path to full economic recovery. A few of these metrics are below.
Downtown Revitalization Dashboard
February 2026 (January data)
As downtown Seattle’s revitalization continues, DSA will publish a monthly dashboard update examining key metrics that affect our urban core’s vitality and progress. The data sets provide a comparison point to the same period in 2019. Additionally, the dashboard will feature notable stories that provide context regarding downtown’s renewal and reemergence.
Please credit the Downtown Seattle Association Revitalization Dashboard for use of charts, data and images on this page.
Unique monthly visitors compared to 2019
More than 2.5 million unique visitors came downtown in January 2026. This represents 108% of the visitors seen in January 2019 and a 10% increase from January 2025 as several major events drew visitors downtown last month (see Of Note section).
Average weekday worker foot traffic
In January, downtown’s worker foot traffic was 58% of January 2019’s daily average. Note: January worker data include both holidays, as well as the day after New Year’s Day.
Monthly hotel rooms sold compared to 2019
More than 251,000 downtown hotel rooms were sold in January 2026. This figure represents 88% of the demand in January 2019, but a 4% increase in demand compared to January 2024.
Quarterly
In January, the number of occupied apartment units downtown continued growing, rising to more than 61,000 — a new high. This represents a 2% increase compared to Q1 2024 and a nearly 30% increase compared to Q1 2019.
Of Note in Downtown
![]()
The two home Seahawks playoff games attracted considerable foot traffic downtown. On Jan. 17, when Seattle hosted the NFC Divisional Round playoff between the Seahawks and 49ers, was the busiest January day downtown since before 2019 with 378, 521 people in the heart of the city.
![]()
In January 2026, downtown saw a 14% increase in the number of unique visitors coming from more than 150+ miles away. The two days featuring the Seahawks playoff games (Saturday, Jan. 17 and Sunday, Jan. 25) were the two busiest days last month for long distance visitors, more than double the typical January weekend.
![]()
In the last 12 months, the DSA/MID Clean Team collected 1,309,101 gallons of trash from downtown sidewalks, curblines and alleys. The highest monthly total was March 2025 with nearly 128,000 gallons of trash removed.
Coming Up in Downtown

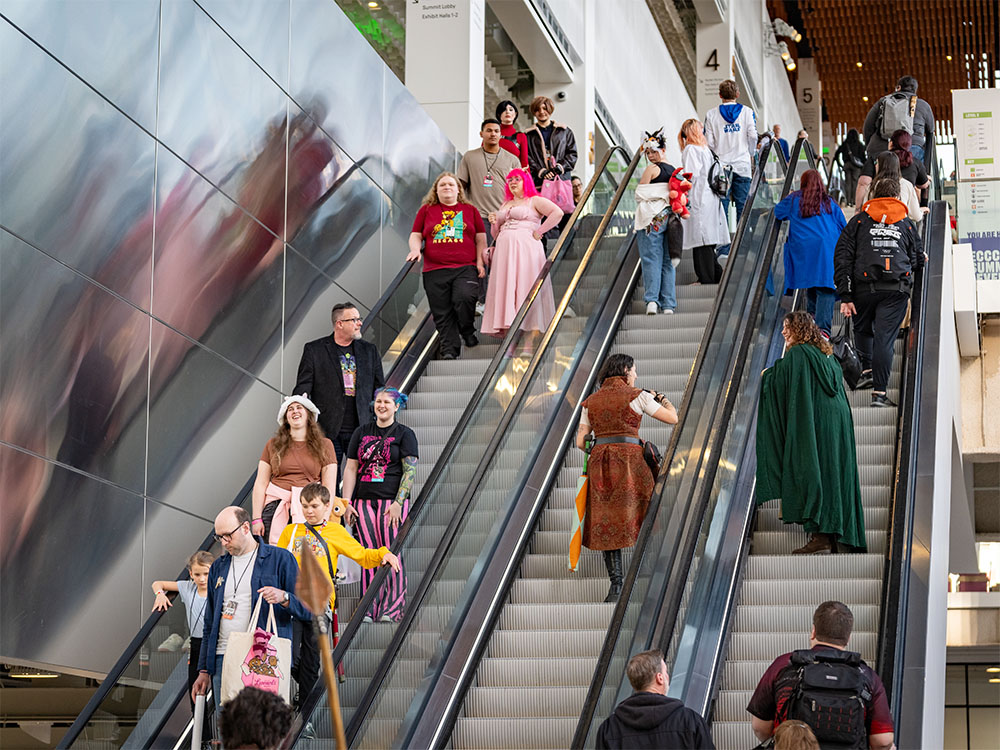
Four days of celebrities, comic creators, authors, actors and pop culture fun take over the Seattle Convention Center March 5–8 for the 2026 Emerald City Comic Con. This is truly a sight to behold as 75,000 fans flock to downtown Seattle for panels, exhibits, booths and much more.

Pacific Northwest Ballet will be performing Kent Stowell’s Firebird for the first time in 20 years. This has been dubbed a “theatrical one act ballet” and described as a “fiery production that will keep you on your toes from start to finish.”

The American League West champion Seattle Mariners open their defense of the division crown with the 2026 home opener March 26 against the Cleveland Guardians. Tridents up!
Notes on Sources
Datafy measures consumer spending by analyzing a cross‑section of credit and debit card transactions and cell phone location data.
Downtown foot traffic data are provided by Placer.ai and are based on cell phone location data. Each person is counted once per day. International visitors are not included. Subsets of this data in the charts are as follows:
- Office worker presence is estimated based on visits by workers who were present between 8 a.m. and 6 p.m. on weekdays in downtown Seattle.*
- Hotel data are based on monthly reports from STR, provided by Visit Seattle.
- Apartment occupancy data are from CoStar. This is reported quarterly but the current quarter data are updated in real-time as new information is added to the database.
- Domestic visitors counts those who do not live or work downtown.
- Total foot traffic includes all visits to downtown by domestic visitors, residents and workers.
- Pike Place Market visitors includes domestic visitors who do not live or work at the Pike Place Market.
*Note that workers who have not visited their work site in the past 90 days are classified as “visitors” until they are regularly visiting their work site at least three times in a one-week period.