Downtown Dashboard
July 2026 (June data)
DSA publishes a monthly dashboard examining dozens of key metrics that affect our urban core’s vitality and local economy. The data sets provide a comparison point to the same period in 2019. Additionally, the dashboard will feature notable stories that provide context regarding downtown’s health and progress.
Please credit the Downtown Seattle Association’s Downtown Dashboard for use of charts, data and images on this page.
Unique monthly visitors compared to 2019
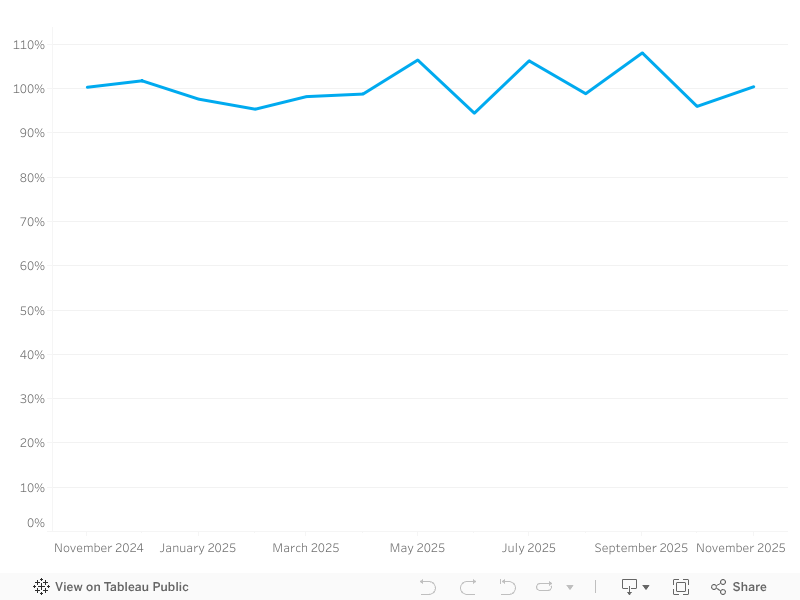
More than 3.2 million unique visitors came downtown in June 2026. This represents 98% of the visitors seen in June 2019 and a 4-point increase from June 2025. Note: Foot traffic only includes domestic visitors.
Average weekday worker foot traffic
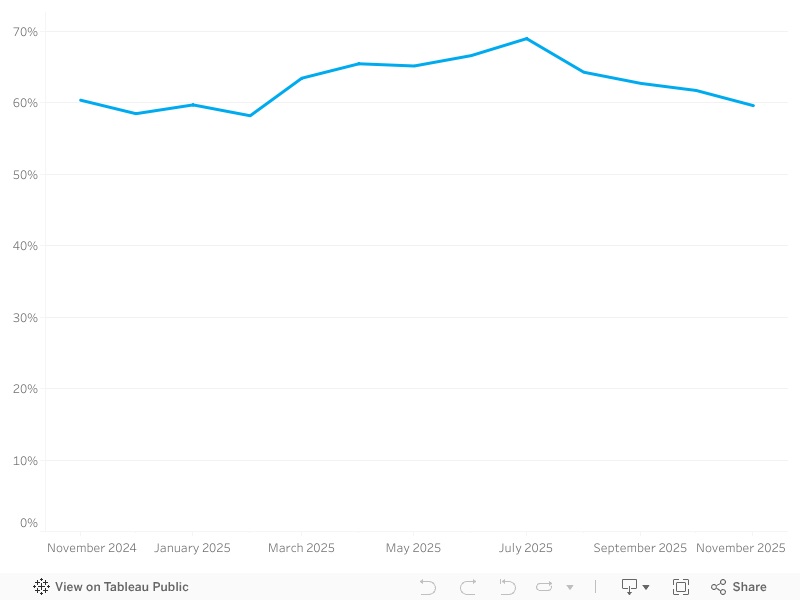
In June, downtown’s worker foot traffic was 64% of June 2019’s daily average. June 2026 averaged more than 147,000 daily workers, the highest level of daily worker foot traffic since October 2025.
Monthly hotel rooms sold compared to 2019
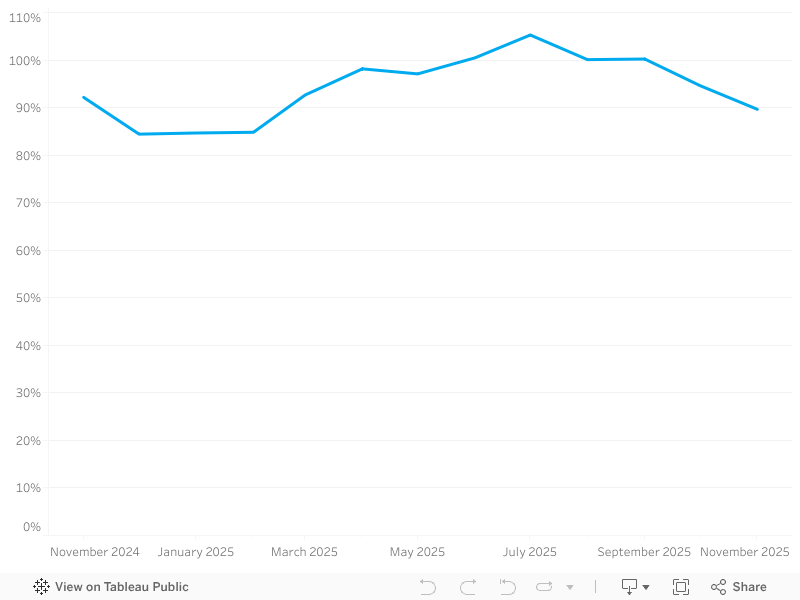
There were 368,400 downtown hotel rooms sold in June 2026. This figure represents 109% of the demand in June 2019, but a 7% decrease in demand compared to June 2025. However, downtown hotels also saw a 25% increase in revenue over the same period.
Quarterly
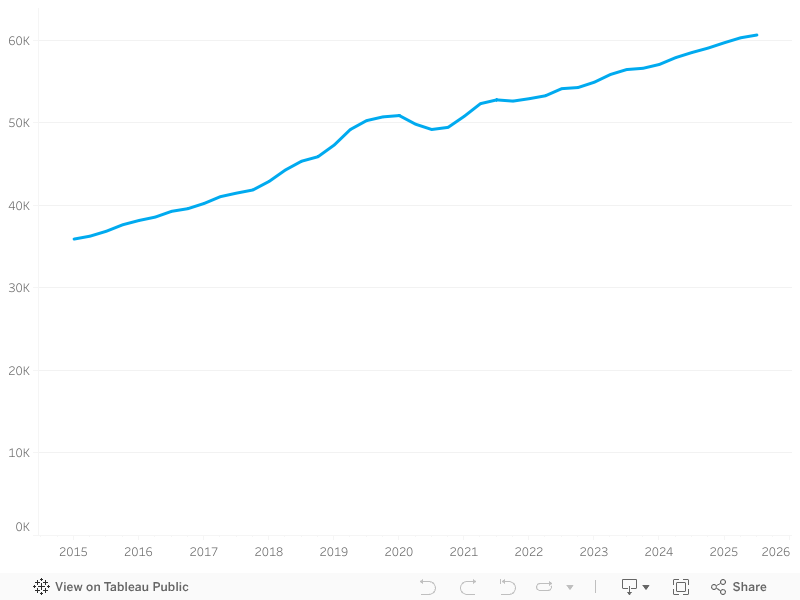
In June, the number of occupied apartment units downtown continued growing, rising to more than 63,000. This represents a 1% increase compared to Q2 2025 and a nearly 21% increase compared to Q2 2019.
Of Note in Downtown
![]()
According to Datafy, consumers spent more than $138.9 million downtown in May 2026, an 8.6% increase over April. Spending on clothing & accessories saw a 26.12% increase from the previous month.
![]()
Sound Transit recently set new monthly and single-day ridership records with 5.4 million boardings in June and approximately 309,000 riders on July 6, the day of the U.S. vs. Belgium match.
![]()
The DSA/MID Clean Team collected 89,681 gallons of trash from downtown sidewalks, curblines and alleys in June, bringing the half-year total to 537,146 gallons of trash.
![]()
More than 3 million people visited downtown across the 6 FIFA World Cup match days in Seattle. This represents a 17% increase in foot traffic over comparable days in 2025. Placer.ai only registers domestic visitors, not international.
Coming Up in Downtown

Seafair’s Torchlight Parade
The pirates return to downtown this month. Seafair’s Torchlight Parade will bring hundreds of thousands of revellers to downtown on July 25. The largest nighttime parade in the Pacific Northwest will once again include MID ambassador teams and the action begins at 7:30 p.m.

Seattle Art Fair
The Pacific Northwest premier contemporary art showcase returns to the Lumen Field Events Center July 23–26. The Seattle Art Fair features more than 100 local, national and international galleries. Admission is free for kids 12 & under.

Downtown Summer Sounds
The annual sign of summer downtown is in full swing. Downtown Summer Sounds, presented in partnership with Amazon, Seattle Parks & Recreation and The State Hotel, rolls on in July with three main stage shows in Westlake Park.
Notes on Sources
Datafy measures consumer spending by analyzing a cross‑section of credit and debit card transactions and cell phone location data.
Downtown foot traffic data are provided by Placer.ai and are based on cell phone location data. Each person is counted once per day. International visitors are not included. Subsets of this data in the charts are as follows:
- Office worker presence is estimated based on visits by workers who were present between 8 a.m. and 6 p.m. on weekdays in downtown Seattle.*
- Hotel data are based on monthly reports from STR, provided by Visit Seattle.
- Apartment occupancy data are from CoStar. This is reported quarterly but the current quarter data are updated in real-time as new information is added to the database.
- Domestic visitors counts those who do not live or work downtown.
- Total foot traffic includes all visits to downtown by domestic visitors, residents and workers.
- Pike Place Market visitors includes domestic visitors who do not live or work at the Pike Place Market.
*Note that workers who have not visited their work site in the past 90 days are classified as “visitors” until they are regularly visiting their work site at least three times in a one-week period.